Hi, I’m higashi.
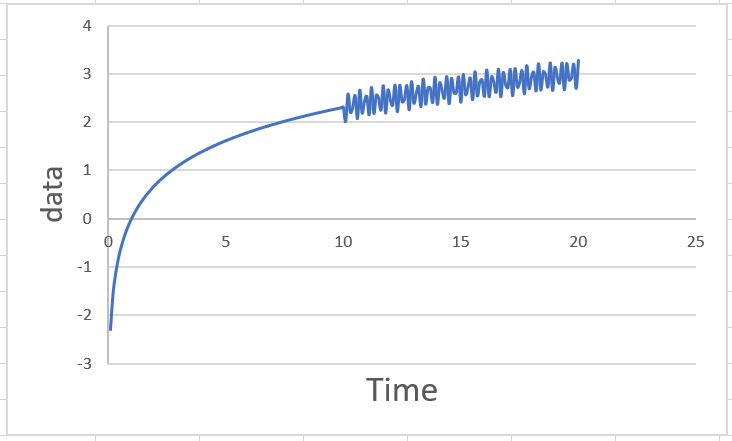
A few days back, I encountered the data that is shown below when I building an AI.

This data is smooth in the beginning, but in the ending has noise.
It was difficult to remove noise without receive a effect to the smooth region.
But finally, I could remove it in good style, so I introduce how to it by using python library.
Introduce of Sample Data
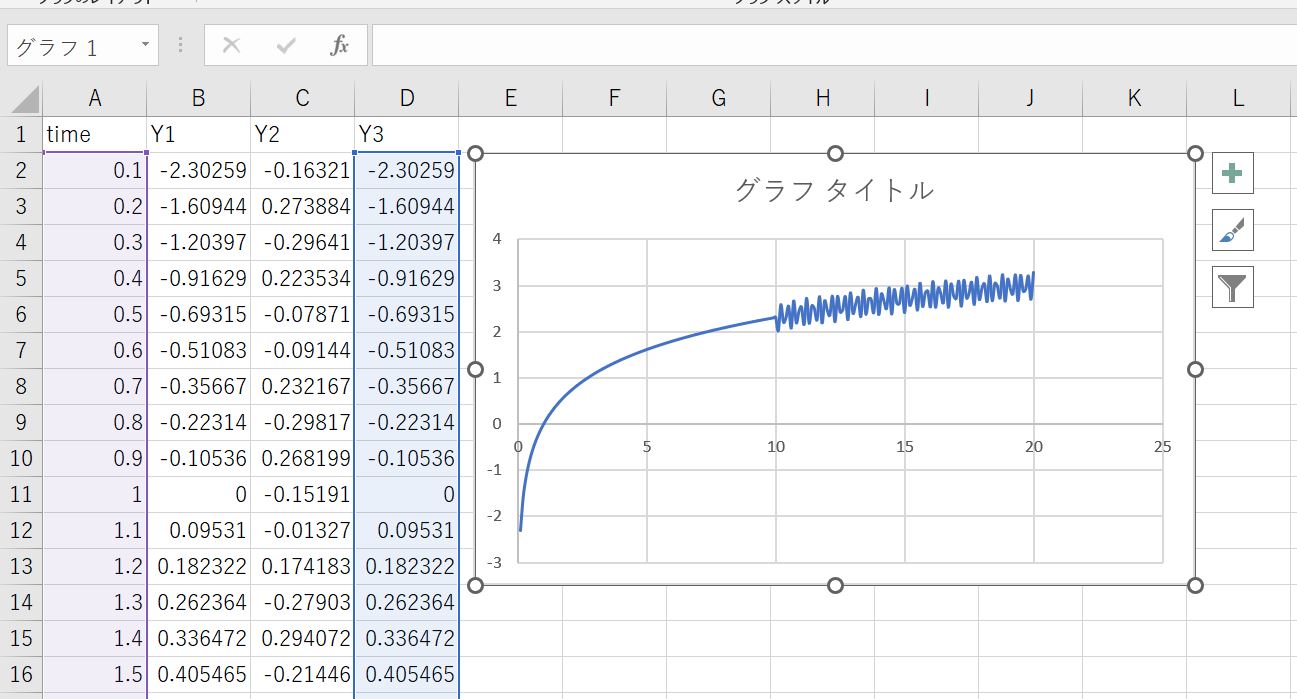
The sample data is saved to csv data like below.

Time is in the first column, the data has noise is in the 4th column.
How to Remove Noise by Using SCIPY
In this issue, scipy that is one of a python library will be used.
Especially, the method named ‘signal.savgol_filter’ is used.
How to use is as shown below.
import scipy.signal
smooth1=scipy.signal.savgol_filter(row_data, window, deg)
※’smooth1′ has the data after noise reduction, ‘row data’ is original data which has noise.
And ‘window’ is the time used for data smoothing, ‘deg’ is dimension for the approximate representation.
By using larger value of ‘window’, the data will be smoothed, and larger value of ‘deg’ will remain noise.
These values need to adjust for good removal.
Demonstration of Noise Removal by using SCIPY
I demonstrate the noise removal by using the data that is shown the beginning of this page.
The sample code is below.
#import library
import pandas as pd
import matplotlib.pyplot as plt
import scipy.signal
#load data
datafile='sample_data.csv'
data=pd.read_csv(datafile).values
row_data=data[:,3]
#noise removal process
window=21
deg=3
smooth1=scipy.signal.savgol_filter(row_data, window, deg)
#check data by making graph
plt.plot(data[:,0], row_data)
plt.plot(data[:,0], smooth1)
plt.ylim(0,4)
plt.show()
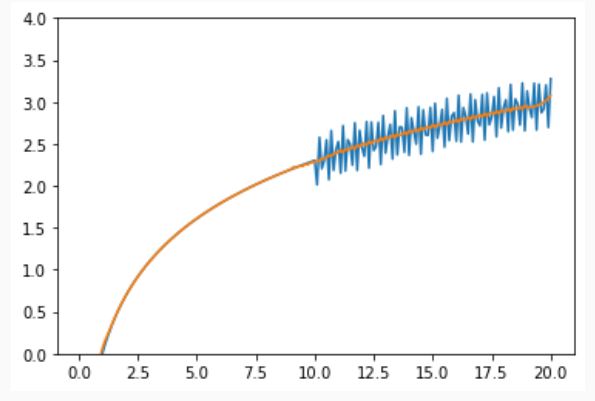
By conduct this program, this result was shown.

Blue color is original data which has noise, and orange color is the data after noise reduction.

I think it is nice noise removal.
That’ all. Thank you!!


コメント